TrategyMulti-Indicator Trading System - Detailed Description
═══════════════════════════════════════════
OVERVIEW
This indicator combines four proven technical analysis tools (EMA, RSI, MACD, ATR) with a specific logic that filters out low-probability setups. Unlike simple indicator mashups, this system requires all conditions to align simultaneously before generating a signal, significantly reducing false entries.
═══════════════════════════════════════════
CORE COMPONENTS & LOGIC
1. Trend Detection - Triple EMA Filter
The system uses three Exponential Moving Averages (5, 10, 20 periods) to establish trend direction and strength:
For LONG signals:
• EMA(5) must be above EMA(10)
• EMA(10) must be above EMA(20)
• Price must be trading above all three EMAs
This creates a "stacked EMA" configuration that confirms a strong uptrend.
For SHORT signals:
• EMA(5) must be below EMA(10)
• EMA(10) must be below EMA(20)
• Price must be trading below all three EMAs
This inverse configuration confirms a strong downtrend.
2. Momentum Confirmation - RSI Filter
The RSI (14-period) acts as a momentum filter to avoid entering during exhausted moves:
For LONG signals:
• RSI must be above 40 (avoiding oversold extremes)
• RSI must be rising (current RSI > previous RSI)
For SHORT signals:
• RSI must be below 60 (avoiding overbought extremes)
• RSI must be falling (current RSI < previous RSI)
This prevents entries at extreme overbought/oversold levels while confirming momentum direction.
3. Entry Trigger - MACD Crossover
The MACD (12, 26, 9) provides the precise entry timing:
LONG trigger: MACD line crosses above Signal line
SHORT trigger: MACD line crosses below Signal line
The signal only fires when this crossover occurs while all other conditions are already met.
4. Risk Management - ATR-Based TP/SL
Take Profit and Stop Loss levels are calculated dynamically using the 14-period ATR (Average True Range), adjusted for timeframe:
5-Minute Charts:
• Take Profit: 1.0 × ATR
• Stop Loss: 0.5 × ATR
4-Hour Charts and above:
• Take Profit: 2.0 × ATR
• Stop Loss: 1.0 × ATR
This adaptive approach accounts for different volatility levels across timeframes.
═══════════════════════════════════════════
SIGNAL GENERATION LOGIC
A signal is only generated when ALL four conditions are simultaneously true:
LONG Signal Requirements:
1. ✓ Triple EMA alignment (bullish stack)
2. ✓ Price above all EMAs
3. ✓ RSI > 40 and rising
4. ✓ MACD bullish crossover
SHORT Signal Requirements:
1. ✓ Triple EMA alignment (bearish stack)
2. ✓ Price below all EMAs
3. ✓ RSI < 60 and falling
4. ✓ MACD bearish crossover
This multi-layered filtering approach is what differentiates this system from basic indicator combinations.
═══════════════════════════════════════════
WHY THIS COMBINATION WORKS
Trend + Momentum + Timing:
• EMAs establish the overall trend context
• RSI confirms momentum is present (not exhausted)
• MACD provides precise entry timing
• ATR adapts risk management to current volatility
Key Innovation: The system waits for all filters to align rather than acting on individual signals, which significantly reduces whipsaws and false breakouts common in single-indicator strategies.
═══════════════════════════════════════════
OPTIMIZED TIMEFRAMES
While the indicator works on all timeframes, it has been specifically optimized and backtested on:
• 5-minute charts (for scalping/day trading)
• 4-hour charts (for swing trading)
The ATR multipliers automatically adjust based on the selected timeframe.
═══════════════════════════════════════════
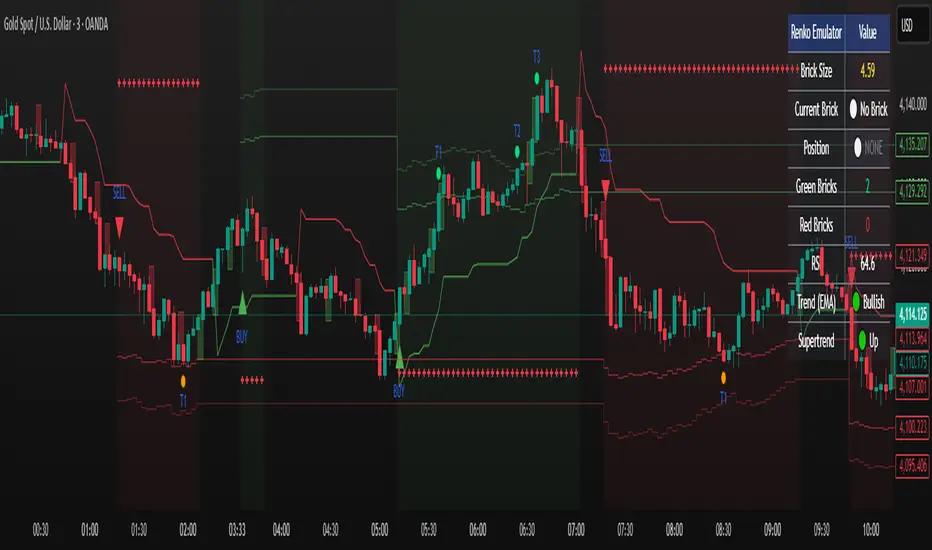
VISUAL FEATURES
• Green arrows below bars: Long signal
• Red arrows above bars: Short signal
• Green line: Take Profit level
• Red line: Stop Loss level
• Alert capability: Configurable alerts for paid TradingView subscriptions
═══════════════════════════════════════════
HOW TO USE
1. Add the indicator to your chart
2. Wait for a colored arrow to appear
3. Enter the trade in the direction of the arrow
4. Set your Take Profit at the green line
5. Set your Stop Loss at the red line
6. (Optional) Set up alerts to receive notifications
Note: Not every arrow will show TP/SL lines. Lines only appear when the ATR-based calculation determines there is sufficient volatility to justify the trade setup.
═══════════════════════════════════════════
WHAT MAKES THIS INVITE-ONLY WORTHY
Unlike free indicators that simply plot standard EMAs, RSI, or MACD separately, this system:
1. Integrates all four indicators with specific thresholds designed to work together
2. Uses adaptive risk management that adjusts to timeframe and volatility
The value lies not in the individual components (which are public domain) but in the specific combination logic, thresholds, and ATR-based risk system that took months of testing to optimize.
═══════════════════════════════════════════
ACCESS INFORMATION
This is an invite-only indicator. To request access:
• Visit our website
We offer both monthly subscriptions and lifetime access.
═══════════════════════════════════════════
RISK DISCLAIMER
This indicator is a technical analysis tool and does not constitute financial advice. All trading involves substantial risk of loss. Past performance does not guarantee future results. The indicator provides signals based on historical price patterns, but cannot predict future market movements. Always use proper risk management and never risk more than you can afford to lose.
═══════════════════════════════════════════
Questions? Feel free to message us on TradingView, or to email us.
Pine Script®指标